For a project at university I recently needed a plotting widget to display some data. Naturally, Qwt came to my mind. I’ve already been using it in a number of other projects and it works great.
The one drawback, however: The project was intended to be run on the Raspberry Pi. Now the X-Server on the R-Pi doesn’t have any 3D acceleration yet, so the performance of Qwt was subpar.
Luckily, Qt has the eglfs backend (using Broadcom’s EGL libraries), which works very well on the R-Pi. The problem: You have to use QML/QtQuick with that, so Qwt was out of the game (actually, I’ve played around with creating a QtQuick backend for Qwt, but with Qwt being QPainter-based, still, it was nowhere near performant enough). A more QtQuick-like solution was needed.
Since QtQuick supports the HTML5 Canvas API, I thought that maybe some HTML5 chart library like Chart.js could do the trick. The good news: It works pretty much out of the box and you get very pretty charts. The bad news: performance on the Raspberry Pi is more or less abysmal (on a laptop or desktop PC it’s fine, though). Even some hand-crafted plotting code based on the Canvas API ate the better part of the R-Pi’s CPU when displaying a continuous stream of data. This isn’t actually that much of a wonder, considering that it was all based on JavaScript and has redrawn the whole plot area in an FBO every time there was a data update.
So all of the “simple” solutions where dead ends. Eventually I ended up writing my own plot items, this time based on QtQuick’s Scene Graph to get the best performance out of the little computer. I was actually surprised that no-one had done something like this yet – or at least I couldn’t find anything.
Anyway, here’s a screenshot of the thing displaying a sine wave with axes:
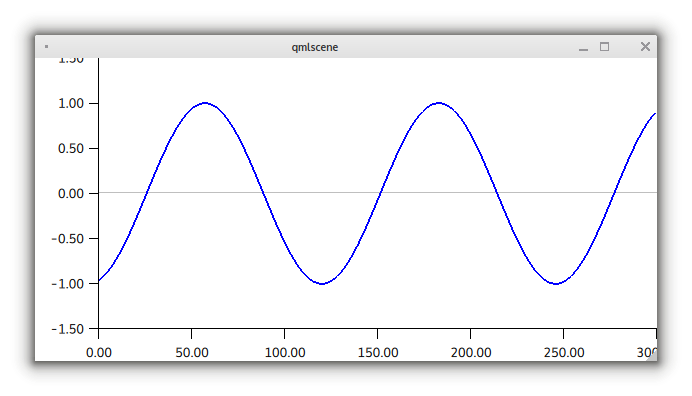
The sine wave is actually scrolling through the view, always showing the most recent 300 data points of the data source. It’s even anti-aliased on most hardware, including the R-Pi, just not on my laptop’s Intel GPU on which I took the screenshot. The performance on the Raspberry Pi is now very good, using less than 5% of the CPU, while the other solutions where north of 70% for a continuously updated data source (values from top, not claiming any sort of accuracy).
The API is somewhat inspired by Qwt’s. There’s the PlotArea Item which is responsible for managing all items of the plot. It keeps a collection of PlotItems, displays the axes and makes the used ScaleEngines (used for the axis limits) known to every item and axis in the plot.
I haven’t implemented more than the most basic PlotItems and ScaleEngines at the moment (because those are currently the only things I need):
Curve: exactly what the name implies – a set of points connected by lines.ScrollingCurve: A curve which only displays the last N data points. If the data is continuously updated, this looks as if the curve is scrolling from right to left.TightScaleEngine: AScaleEnginewhich sets the axis limits to the overall minima and maxima of all the plot items.FixedScaleEngine: AScaleEnginewhich sets the axis limits to constant values.
The axis ticks are placed based on the nicenum algorithm from the Graphics Gems book series from Academic Press. The API is designed with C++/Qt data sources in mind: Data is passed as QVector<float> or QVector<QPointF>, preferrably as an argument to a signal-slot connection. Note that the usage of QVector makes setting the data statically from QML a little difficult. I’m open for suggestions to improve this, but I would really like to avoid converting a batch of data to a QVariantList and back just to integrate better with QML/JS.
You can find the code on gitorious GitLab, licensed under the GPLv3: https://gitlab.com/qtquickplot/qtquickplot
Edit: Some example code would probably be nice, so here is the QML code used in the above screen shot:
import QtQuick 2.1
import QuickPlot 1.0

Rectangle {
    visible: true
    width: 640
    height: 480

    MouseArea {
        anchors.fill: parent
        onClicked: {
            Qt.quit();
        }
    }

    PlotArea {
        id: plotArea
        anchors.fill: parent

        yScaleEngine: FixedScaleEngine {
            max: 1.5
            min: -1.5
        }

        items: [
            ScrollingCurve {
                id: meter;
                numPoints: 300
            }
        ]
    }

    Timer {
        id: timer;
        interval: 20;
        repeat: true;
        running: true;

        property real pos: 0

        onTriggered: {
            meter.appendDataPoint( Math.sin(pos) );
            pos += 0.05;
        }
    }
}
Edit 2: Due to Gitorious being acquired by GitLab, the code has been moved to the latter: https://gitlab.com/qtquickplot/qtquickplot
https://gerrit.vesnicky.cesnet.cz/r/244 – You might be interested in this..
Thanks, this looks like pretty much what I had needed 🙂 It doesn’t have as much modularity as what I’ve come up with, though. I wonder if there’s a performance hit by rendering into an FBO first. Anyway, I’ll check it out at some point. Thanks again 🙂
> I wonder if there’s a performance hit by rendering into an FBO first.
This was done in order to have antialiasing enabled for the graph (without having it for the full scene)
Hey,
I’m very interested in plotting for Qml – specially because I have an app that’s mostly plotting based. Can you take a look at it to see if it’s complicated to replicate the plotting that we do with your lib, and if so, how can I help your lib to improve to what I need? 🙂
the app is Subsurface Divelog, I will not put the link here so you don’t think it’s a spam. ^^
Sure, I’ll have a look 🙂
Thanks, It’s the only thing that’s misssing for a port to Android / iOS. 😀
Can I suggest an API change to QVector<qreal> instead of QVector<float>? That way it will be much more portable.
Thanks for the feedback. The reason for using QVector instead of QVector is that all the OpenGL stuff is based on floats instead of doubles. But I guess I can add some qreal convenience methods. 🙂
Just to mention it: the probably easiest way to have hardware acceleration for a plot on X11 is to stay with Qt4 using the “native” ( = x11 ) graphics system instead of using the slow software renderer ( “raster” ). This should also work with Qwt – out of the box !
Unfortunately with Qt5 the X11 paint engine is gone and you have to go with OpenGL. But this doesn’t exclude QPainter based render engines ( you can even render to the scene graph using QPainter ! ) – there is a OpenGL paint engine as well.
F.e when setting a QGLWidget as viewport for a QGraphicsView you will run into it ( Qwt has a similar option – somehow experimental – too ).
In fact it is the other way round: using an abstract QPainter API makes a lot of sense for plots. F.e you can render the plot to PDF with the same code !
So the value of your nice project is offering a QML API ( for those who prefer it over C++ ), but the requirement of hardware accelerated graphics doesn’t necessarily end up in Qt/Quick.
As long as we’re going with QtWidgets, you’re completely right. However, with QML, any Item rendered by QPainter is another indirection and makes things slower. To quote from the QQuickItem API docs:
The target of this project is specifically the Raspberry Pi, where the X Server doesn’t have any accelerated OpenGL whatsoever (yet, anyway, until Eric completes his open source driver for the VideoCore).
This leaves the eglfs plugin as the only option, which again only works with QML/QtQuick.